

A geodynamic model of the modern Earth is constructed based on the SMEAN 2 global seismic tomography model with an emphasis on the Arctic region. For a spherical Earth model, a solution of the Stokes equation for a viscous fluid was obtained based on seismic tomography data using the CitcomS code. The resulting distributions of temperature anomalies and velocity fields of mantle flows explain the main features of the modern geodynamics of the Arctic region.
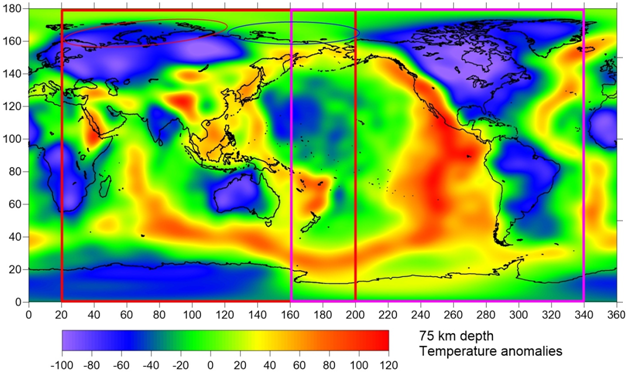
According to calculations, several global convection cells have been formed in the Earth’s mantle, responsible for the general geodynamics and upper mantle flows associated with the plate tectonics, mid-ocean ridges, subduction and collision zones. Smaller upper mantle convective cells and plates form regional structures on the Earth’s surface. In particular, under the Arctic and under part of the shelf of northeast Asia there is a moderately hot region in the upper mantle and subhorizontal mantle flows that provide passive rifting in the Arctic Ocean.The temperature difference in the subcrustal mantle between the relatively “cold” western Arctic shelf (Barents and Kara seas) and the “warmer” eastern Arctic shelf (from the Laptev Sea to the Bering Strait) reaches 100 degrees, which correlates with the observed intense methane emission from the shallow shelf of the Eastern Arctic caused by permafrost degradation and destruction of gas hydrates against the background of elevated environmental temperatures. The greenhouse effect of methane in the atmosphere, in turn, contributes to climate warming in the Arctic. The region of Iceland and eastern part of Greenland, under the influence of the mantle upwelling, is characterized by a hot subcrustal mantle and increased heat flow at the surface, causing instability and melting of the Greenland ice sheet from below.
Source: L. I. Lobkovsky, A. A. Baranov, A. M. Bobrov, A. V. Chuvaev. Global Geodynamic Model of the Earth and Application to the Arctic Region // Doklady Earth Sciences. 514(2), 354-359 (2024). DOI: 10.1134/S1028334X23603000.